-
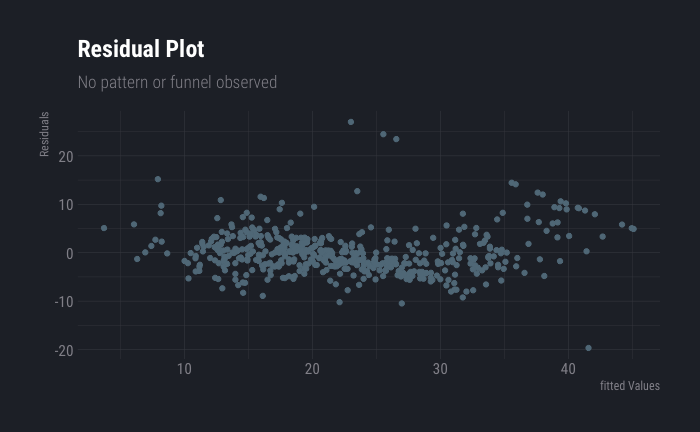
In this article we will try out linear regression on Boston data set. As we go forward in the course, we shall include more complexities. As a first step, let us check for outliers and high leverage points. dt %>% pivot_longer(cols = c(1:14)) %>% ggplot(aes(x=value))+ geom_boxplot()+ facet_wrap(~name) It looks …
Read More -
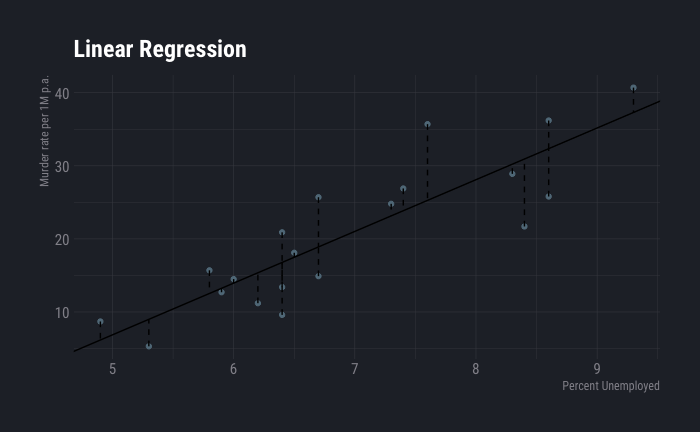
Linear regression is a very simple method of supervised learning. despite widespread use of advanced models it remains one of the most widely used method. In fact many advanced methods are extensions of linear methods. It is extremely important that a data scientist understands linear regression in all aspects. Linear …
Read More -
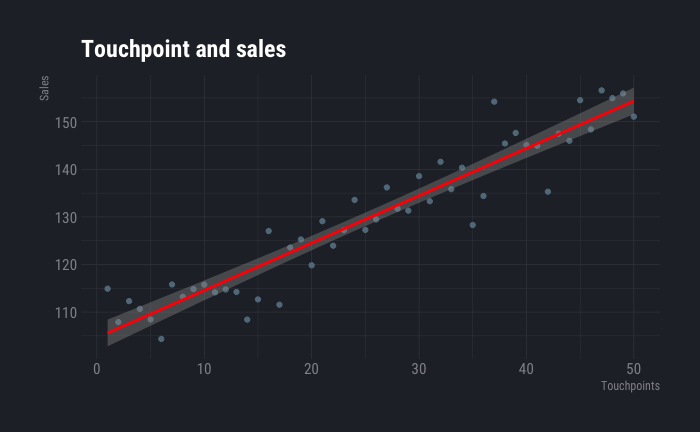
This article creates a stepping stone for deeper understanding of elements of data science. Supervised and unsupervised learning, measuring accuracy of models and bias variance trade off are discussed briefly in this article. Introduction Suppose you are a sales manager in a company and you want to increase your sales. …
Read More -
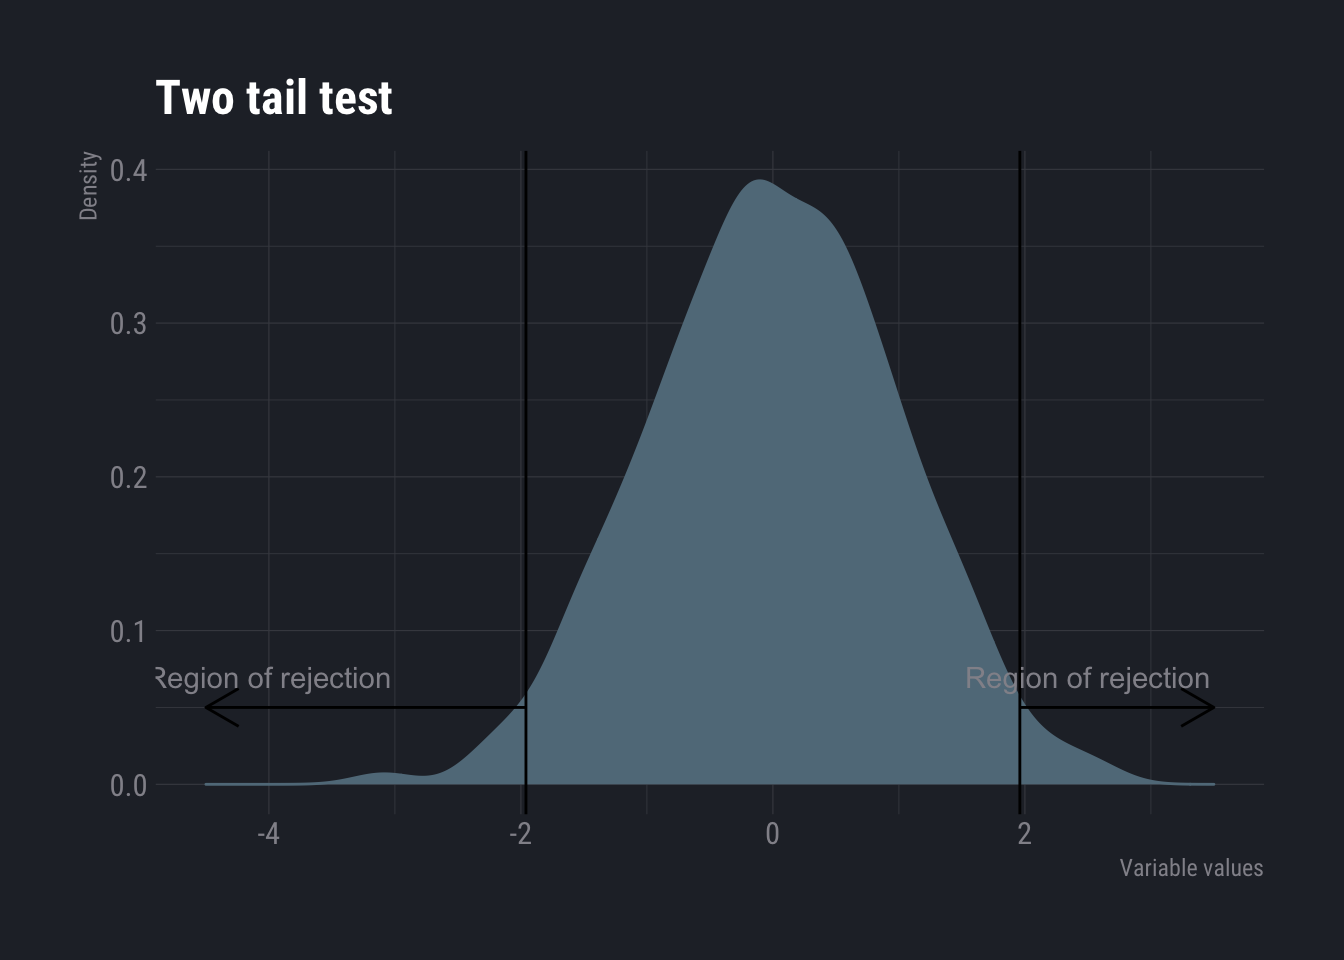
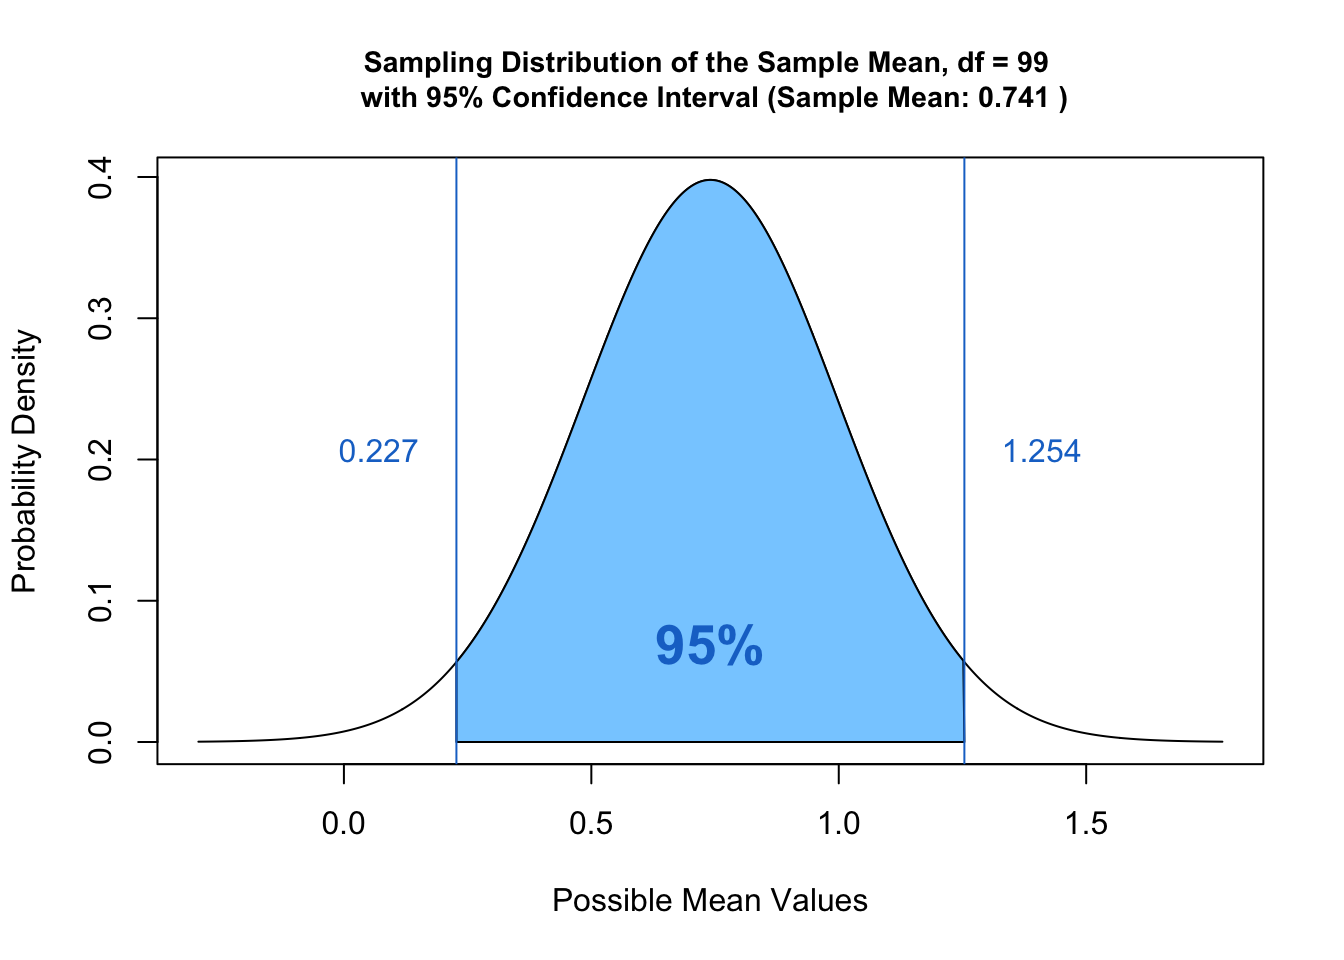
Confidence Interval In a way the idea of inferential statistics (and machine learning) revolve around estimation of population characteristics from sample. Often the estimation is incorrectly calculated as a single point. For example, one may take a random sample of customers in a shop and calculate the average amount …
Read More -
Sample A sample is a subset of a population. Most of the time it is too expensive or impossible to collect population data. The whole idea of inferential statistics (which later evolved to machine learning and AI) revolves around estimation of population parameters by studying parameters of samples. Samples and sample …
Read More -
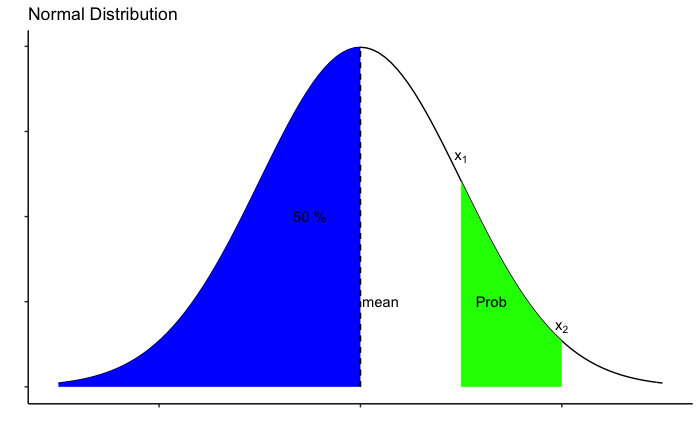
Probability distribution In our last article we focused on basics of probability and discussed how it is calculated empirically. In this article we will try to understand how probabilities can be calculated from mathematical functions. There are certain functions for which probabilities can be calculated using formulas …
Read More -

Probability Probability is the chance of something happening. For example chances of winning a lottery. Or chances of India winning a particular cricket match. Or chances of a salesperson making a sales etc. In other words, probability quantifies uncertainty. Mathematically, it is defined by ratio of number of outcomes …
Read More -

Locations Often, it is not possible or nor feasible to display plots to express features of data. In such cases we need some other ways to summarize. If you recall from our last article, histograms are mostly to understand How many in which, min, max, most occuring or How many less than or more than in data. For e.g. …
Read More -
Introduction Data Science is a field of study and practice that aims to extract knowledge and information from data. Scientific methods, processes, statistics, mathematics and domain knowledge is used to do so, of course using computational power. Although the term was coined and gained popularity in recent years, one …
Read More